When do fair value gaps fill?
We measured 152 three-candle fair value gaps on Binance BTC/USDT hourly spot candles from October 2026. The results show how often the next 24 candles reached each edge of the gap.
AlgoAlpha ·
Results over the next 24 bars
| Direction | Gaps | Reached near edge | Reached far edge |
|---|---|---|---|
| Bullish | 73 | 63 (86%) | 61 (84%) |
| Bearish | 79 | 65 (82%) | 60 (76%) |
The near edge is the first boundary price approaches from the formation side. We count a full fill when the hourly low or high also reaches or crosses the opposite boundary. The figures describe one month on one market. An hourly candle shows a price range and cannot establish the exact minute of a touch or prove an order filled.
Download the gap observations as CSV. A blank follow-up field means the test recorded no qualifying reach in the next 24 candles.
How we measured the gaps
- Load the October 2026 Binance BTC/USDT spot archive. We verified its checksum and checked the 744 candles for a continuous hourly sequence.
- At the close of candle three, compare it with candle one. A bullish gap has a third-candle low above the first-candle high. A bearish gap has a third-candle high below the first-candle low. The two prices form the zone. We count each qualifying pattern, including overlapping zones.
- Check the next 24 candles. For a bullish gap, look for a low at or below the upper edge, then at or below the lower edge. For a bearish gap, use a high at or above the lower edge, then at or above the upper edge. Leaving out the first two candles and the last 24 leaves 718 eligible formation candles.
This study applies the raw three-candle rule. The Fair Value Gap Profiles indicator also applies a volatility-adjusted size filter and adds lower-timeframe volume. The table measures raw price-zone revisits and does not estimate the performance of a trading strategy.
Find one gap in TradingView Bar Replay
Open BINANCE:BTCUSDT, select the 1-hour interval and set the chart timezone to UTC. Start Bar Replay before the candle that opened at 2026-10-02 04:00 UTC.
When that candle closes at 2026-10-02 05:00 UTC, the raw bullish gap runs from 85189.97 to 85453.36 USDT. Advance one bar at a time. In the archive, the range first reached the near edge on the following bar 10 and the far edge on bar 11.
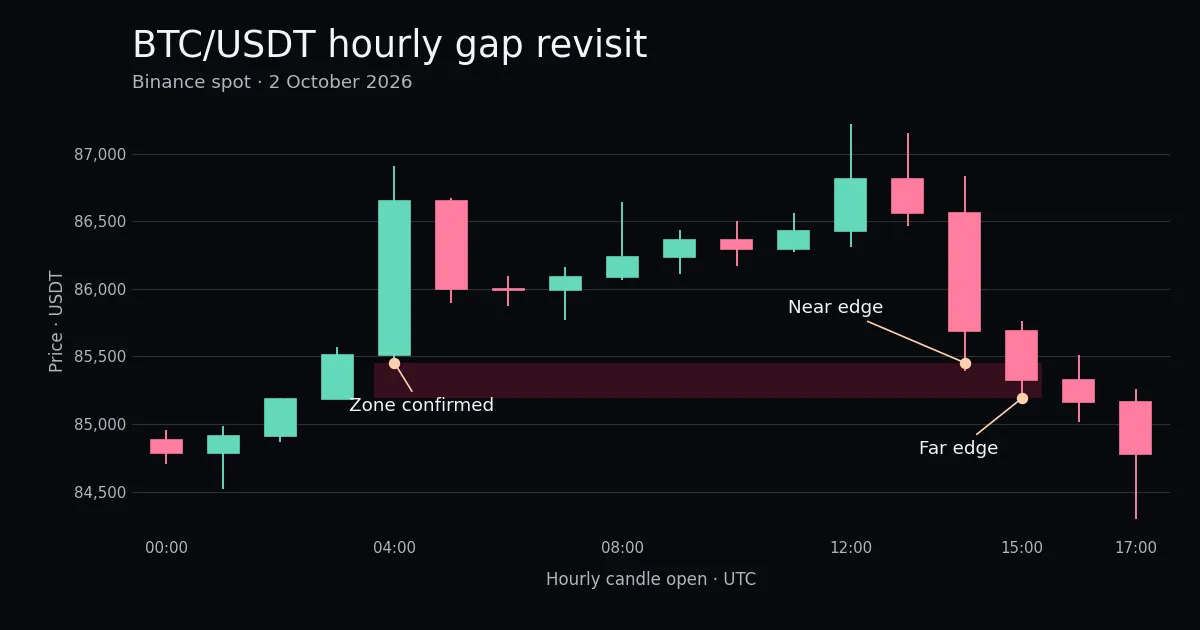
Add Fair Value Gap Profiles on TradingView and compare the raw zone with what the indicator plots at your settings. Record the first bar on which any zone appears and the settings you used.